Stats
Correlation
- naplib.stats.pairwise_correlation(A, B, axis=0)[source]
Compute Pearson correlation between A and B along a specified axis.
The correlation is computed pairwise for each corresponding element along the remaining dimensions. The output will have the same shape as the inputs, but with the specified
axisremoved.The correlation is calculated as: $$r = frac{sum (A_i - bar{A})(B_i - bar{B})}{sqrt{sum (A_i - bar{A})^2 sum (B_i - bar{B})^2}}$$
- Parameters:
A (np.ndarray) -- First array.
B (np.ndarray) -- Second array. Must be the same shape as A.
axis (int, default=0) -- The axis along which to compute the correlation (e.g., the time dimension).
- Returns:
corr -- Pairwise correlations. If inputs are 1D, returns a float. Otherwise, returns an array of shape equal to the input shape with the
axisdimension removed.- Return type:
np.ndarray or float
Examples using pairwise_correlation
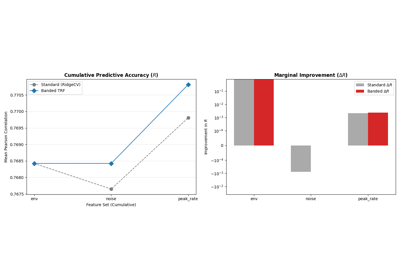
TRF Comparison: Iterative RidgeCV vs. Banded Regularization
T-Test Responsive Electrodes
- naplib.stats.responsive_ttest(data=None, resp='resp', befaft='befaft', sfreq='dataf', pre_post=[1, 1], alpha=0.05, average=False, fdr_method='indep', alternative='two-sided', equal_var=True)[source]
Identify responsive electrodes by performing a t-test between response values during silence (before stimulus) compared to during speech/sound (after stimulus onset) [1]. scipy's ttest_ind is used to perform the t-test. Please see their documentation for more details.
- Parameters:
data (naplib.Data instance, optional) -- Data object containing data to be normalized in one of the field. If not given, must give the X and y data directly as the
Xandyarguments.resp (str | list of np.ndarrays or a multidimensional np.ndarray) -- Electrode responses to each trial, containing a portion at the beginning which is the response to silence before the start of the stimulus. Once arranged, each trial should be of shape (time, num_channels). If a string, it must specify one of the fields of the Data provided in the first argument. If a multidimensional array, first dimension indicates the trial/epochs.
befaft (str | list of np.ndarrays or a single np.ndarray, default='befaft') -- If a string, specifies a field of the Data which contains the period before and after sound onset (in sec) for each trial. Otherwise, a list should contain the befaft period for each trial, and a single np.ndarray of length 2 specifies the befaft period for all trials. For example, befaft=np.array([0.5, 0.5]) indicates that for each trial, the first half second of the responses come before the stimulus onset. If no Data is provided, this cannot be a string. Note: if this is a list it must be of same length as the resp, so to specify the same befaft for all trials, use a np.ndarray of length 2.
sfreq (str | int, default='dataf') -- The sampling frequency of the responses. If a string, specifies field of the Data containing the sampling frequency.
pre_post (np.ndarray | list, default=[1, 1]) -- List or array of length 2 or 4, giving the time windows (in seconds) to compare before and after stimulus onset. If length 2 (such as [x,y]), both numbers must be positive floats, and the first number specifies the window [-x, 0) relative to sound onset while the second number specifies the window [0, y) relative to sound onset. The responses in these two windows will be compared by the t-test. If length 4, the first two floats specify the start and end points of the first window (relative to sound onset), and the remaining two floats specify the start and end points of the second window. Thus, the following two inputs produce the same windows and the same test, [0.8, 1] and [-0.8, 0, 0, 1], whereby the responses in the 0.8 seconds immediately preceeding stimulus onset are compared to the responses in the 1 second immediately following stimulus onset. Sometimes, sound does not onset until a little later after stimulus onset, and there is also neural delay for many electrodes, so one good pre_post option could be [-1, 0, 0.2, 1.2] to add a buffer of 200ms for the electrodes to begin responding more strongly.
alpha (float, default=0.05) -- Error rate.
average (bool, default=False) -- Whether to average each segment before t-test or not. Should only be used if have a sufficiently high number of trials, because this will create one comparison per trial.
fdr_method (str, {'indep', 'negcorr', None}, default='indep') -- Method of correction for multiple comparisons. If 'indep' it implements Benjamini/Hochberg for independent or if 'negcorr' it corresponds to Benjamini/Yekutieli. If None, no false discovery rate correction is performed.
alternative (str, {‘two-sided’, ‘less’, ‘greater’}, default='two-sided') --
The the alternative hypothesis. Must be one of the following: * 'two-sided': the means of the distributions of the response values before
and during sound are unequal.
'less': the mean of the distribution of response values before stimulus onset is less than the mean of the distribution of response values after stimulus onset
'greater': the mean of the distribution of response values before stimulus onset is greater than the mean of the distribution of response values after stimulus onset
equal_var (bool, default=True) -- If True, perform a standard independent 2 sample test that assumes equal population variances [2]. If False, perform Welch's t-test, which does not assume equal population variance [3].
- Returns:
out (list of np.arrays, same as resp input type) -- A list of numpy arrays, each of shape (time, new_num_channels)
stats (dict) -- Dictionary containing statistics about responsive elecs, with the following keys - 'pval' : p-values, shape (num_channels,) - 'stat' : test statistic, shape (num_channels,) - 'significant': True if null hypothesis was rejected (response is significantly different), False if not, shape (num_channels,) - 'alpha': error rate of the test
Examples
>>> import naplib as nl
>>> data = nl.io.load_speech_task_data()
>>> # Get responsiveness of the 10 electrodes, assuming that they must show an increase
>>> # response to the stimulus, and averaging segment windows
>>> new_data, stats = responsive_ttest(data, average=True, alternative='less')
>>> # All 10 electrodes have significant responses
>>> stats['significant']
array([ True,  True,  True,  True,  True,  True,  True,  True,  True,
    True])
References
Examples using responsive_ttest

T-Test with Feature Control
- naplib.stats.ttest(*args, classes=None, cat_feats={}, con_feats={}, return_ols_result=False)[source]
Perform a t-test under the linear model framework, allowing for additional features to be controlled. For example, performing a paired t-test between samples while controlling for the group identity that each sample comes from.
If no categorical or continuous features are given, then this function can reproduce scipy's ttest_1samp, ttest_rel, or ttest_ind. Please see the Examples below for details on this equivalence. However, if any additional features are provided, they are treated as extra predictors in a linear model framework, therefore controlling for their impact when estimating the test statistic.
In the case of neural data, a common use-case for this is when testing a distribution of data points, each of which comes from a group, like a subject. For example, we may have 3 subjects, each of which has 10 electrodes, and we want to perform a relative t-test between each electrode's value during condition A and condition B. This function allows us to perform that test while controlling for the impact of subject identity by providing a subject identity categorical feature to the model which it uses to aid it its prediction.
- Parameters:
x (array-like, shape (n_samples,)) -- Data to test. All samples may come from a single class, in which case a one sample t-test is performed compared to a null hypothesis of mean=0, or from multiple classes if
classesis provided as well, in which case an independent two-sample t-test is performed.y (array-like, shape (n_samples,), optional) -- If provided, must be the same shape as x and a paired t-test is performed between x and y.
classes (array-like, shape (n_samples,), optional) -- An array of 0's and 1's to separate the two classes to compare in an independent two-sample t-test if only x is provided without y.
cat_feats (array-like, dict or DataFrame, optional) -- Categorical features to control for, given as an array-like or dict-like object (including a dict, a pd.DataFrame, etc). If given as dict-like, each key specifies the name of the factor to control for, and the value is an array-like of shape (n_samples,) of that factor's values. If an array, then each column provides a categorical factor to control for. All features are automatically one-hot encoded. If performing an independent 2-sample ttest where classes were provided, then if this is dict-like, it cannot contain a key called "classes".
con_feats (array-like, dict or DataFrame, optional) -- Continuous features to control for, given as an array-like or dict-like object (including a dict, a pd.DataFrame, etc). If given as dict-like, each key specifies the name of the factor to control for, and the value is an array-like of shape (n_samples,) of that factor's values. If an array, then each column provides a continuous factor to control for. These features are converted to floats automatically. Key names must not overlap with cat_feats if given as dict-like.
return_ols_result (bool, default=False) -- Whether to return the ols result object as a third item in the tuple.
- Returns:
statistic (float) -- T-value statistic.
pvalue (float) -- p-value.
ols_result (statsmodels.regression.linear_model.RegressionResultsWrapper) -- Only returned if
return_ols_result=True
Examples
>>> from naplib.stats import ttest
>>> import numpy as np
>>> rng = np.random.default_rng(10)
>>> # Imagine we have data that comes from two underlying subjects pooled together
>>> x1 = rng.normal(size=(10,1))    # subject 1 data
>>> x2 = rng.normal(size=(10,1))+4  # subject 2 data
>>> x = np.concatenate([x1,x2])     # pooled data
>>> x1_group = np.zeros((10,))
>>> x2_group = np.ones((10,))
>>> groups = np.concatenate([x1_group,x2_group])    # pooled subject identity vector
>>> # Also, each data point from each subject comes from one of three behavior types
>>> behavior = np.array([0, 0, 0, 1, 1, 1, 2, 2, 2, 0])
We can perform a 1-sample t-test on all the x values assuming a null population mean of 0. This is equivalent to scipy.stats.ttest_1samp(x, popmean=0)
>>> ttest(x)
(3.9115219870652487, 0.0009378023836864556)
Or we can do the same test but take into account the subject identity of the samples.
>>> ttest(x, cat_feats=groups)
(-0.33532229593097984, 0.7412584236348754)
If x1 and x2 are paired data, we can do a paired relative t-test. This is equivalent to scipy.stats.ttest_rel(x2, x1)
>>> ttest(x2, x1)
(11.052116218441915, 1.5470048033033527e-06)
Or the same test but take into account the behavior type of each sample.
>>> ttest(x2, x1, cat_feats=behavior)
(11.761977075053782, 7.272560323998328e-06)
If x1 and x2 are not paired, we can do an independent 2 sample t-test. This is equivalent to scipy.stats.ttest_ind(x2, x1)
>>> ttest(x, classes=groups)
(11.335049583473713, 1.256342249131581e-09)
Or the same test but take behavior into account. Since the cat_feats parameter must have the same number of samples as the input data, we need to concatenate the behavior so that we have a behavior indicator for each sample in x.
>>> behavior_x1x2 = np.concatenate([behavior, behavior], axis=0)
>>> ttest(x, classes=groups, cat_feats=behavior_x1x2)
(11.682487719722063, 3.0312825227658624e-09)
Discriminability
- naplib.stats.discriminability(D, L, elec_mode='all', method='lda')[source]
Compute discriminability of classes over time. Can use multiple electrodes jointly, or compute the discriminability by each electrode individually. Multiple methods available.
- Parameters:
D (array-like of shape (electrodes, time, instances)) -- Data features over time.
L (array-like containing labels for each instance) -- L is either of shape (instances,) if each instance has the same label across the full time axis, or is of shape (time, instances). Must be categorical to indicate class membership for each instance.
elec_mode (string, one of ['all', 'individual']) -- if 'all', computes f-ratio over all electrodes together, and returns f-ratio of shape (time,) if 'individual', computes f-ratio for each electrode individually and returns f-ratio of shape (electrodes, time)
method (string, default='lda') -- Method for computing discriminability. Options are 'lda', 'wilks-lambda'.
- Returns:
fratio (np.ndarray) -- if elec_mode=='all', shape=(time,) if elec_mode=='individual', shape=(electrodes, time)
pvalues (np.ndarray) -- Only returned if method is 'wilks-lambda'. Shape is the same as
fratio.
Examples
>>> from naplib.stats import discriminability
>>> rng = np.random.default_rng(1)
>>> elecs, t, instances = 2, 5, 50
>>> D = np.concatenate([rng.normal(size=(elecs, t, instances)),
...                     rng.normal(loc=1, scale=0.5, size=(elecs, t, instances))],
...                    axis=-1)
>>> # labels for the data, where labels do not change over time
>>> L = np.concatenate([np.zeros((instances,)), np.ones((instances,))])
>>> f_stat, p_val = discriminability(D, L, method='wilks-lambda')
>>> f_stat
array([16.71955996, 19.94997217, 19.0641678 , 15.95256107, 17.90728111])
>>> p_val
array([5.65679222e-07, 5.38811997e-08, 1.01531199e-07, 1.00551882e-06, 2.35186401e-07]))
Linear Mixed Effects Model
- class naplib.stats.LinearMixedEffectsModel(alpha=0.05, zscore_x=False)[source]
A linear mixed effects model which can be used for main effect plots. A mixed effects model is useful when the data has some non-independence whose effect should be accounted for separately from the effects of the independent variables. For example, if half of the data comes from subject A and the other half from subject B, and you want to know the main effects of other predictor features.
- Parameters:
- mixedlm
Object which performs mixed linear model fitting
- Type:
statsmodels.regression.mixed_linear_model.MixedLM object
- mixedlm_results
Object which contains outputs from fitting.
- Type:
statsmodels.regression.mixed_linear_model.MixedLMResults object
- params
Coefficients for each variable.
- Type:
pd.DataFrame
- pvalues
Pvalues for each param.
- Type:
pd.DataFrame
- conf_int
Confidence interval around each param.
- Type:
pd.DataFrame
- rsquared
R-squared value.
- Type:
np.float
- fit(X, y, random_effect=None, varnames=None)[source]
- Parameters:
X (np.array, shape (num_samples, num_features))
y (np.array, shape (num_samples,))
random_effect (np.array, shape (num_samples,), optional) -- If given, used as a random effect in the model. For example, to use group identity as a random effect, this should be an array of integers specifying what group each sample belongs to. The values do not matter, only the categorical groups they form.
varnames (list, optional, default None) -- List of variable names, must be length (num_features+1) or (num_features + num_features_r + 1), giving the name for each feature in X, each feature in random_effect (if given) as well as a name for the predicted output in y.
- Returns:
model
- Return type:
returns an instance of self
- get_model_params()[source]
Get model params after fitting.
- Returns:
param_dict -- dict of model params, pvalues, and confidence intervals for each variable.
- Return type:
- plot_effects(ax=None, plus_minus_colors=None, line_alpha=0.6, markersize=8, center_zero=True, print_ylabels=True)[source]
Create main effects plot.
- Parameters:
ax (pyplot axes, optional, default=gca())
plus_minus_colors (list or np.array, length=2, default red, blue) -- Colors to use for the effect lines when they are significantly positive or negative, respectively.
line_alpha (float, default=0.06) -- alpha value for lines
markersize (float, default=8) -- Size of marker at each effect
center_zero (bool, default=True) -- Whether to put 0 in the center of x-axis.
print_ylabels (bool, default=True) -- Whether to print y labels
- property rsquared
float
- Type:
r-squared
Examples using LinearMixedEffectsModel

Stars for P-Values
- naplib.stats.stars(pvals)[source]
Convert pvalues to strings of stars for significance. thresholds: [inf, 0.05, 0.01, 0.001, 0.001] stars: ['n.s.', '*', '**', '*', '**']
- Parameters:
pvals (float or list/np.ndarray of floats) -- Pvalue or pvalues to convert to stars.
- Returns:
stars
- Return type:
string or list of strings
Examples
>>> import naplib as nl
>>> pvalues = [0.06, 0.03, 0.0008]
>>> nl.stats.stars(pvalues)
['n.s.','*','****']